We believe transparent and accessible data is foundational to our work to make homelessness rare, brief, and non-recurring. These dashboards exist to help the community, A Way Home for Tulsa, and all stakeholders understand the state of homelessness in the Tulsa City and County area.
Provider-Level Data
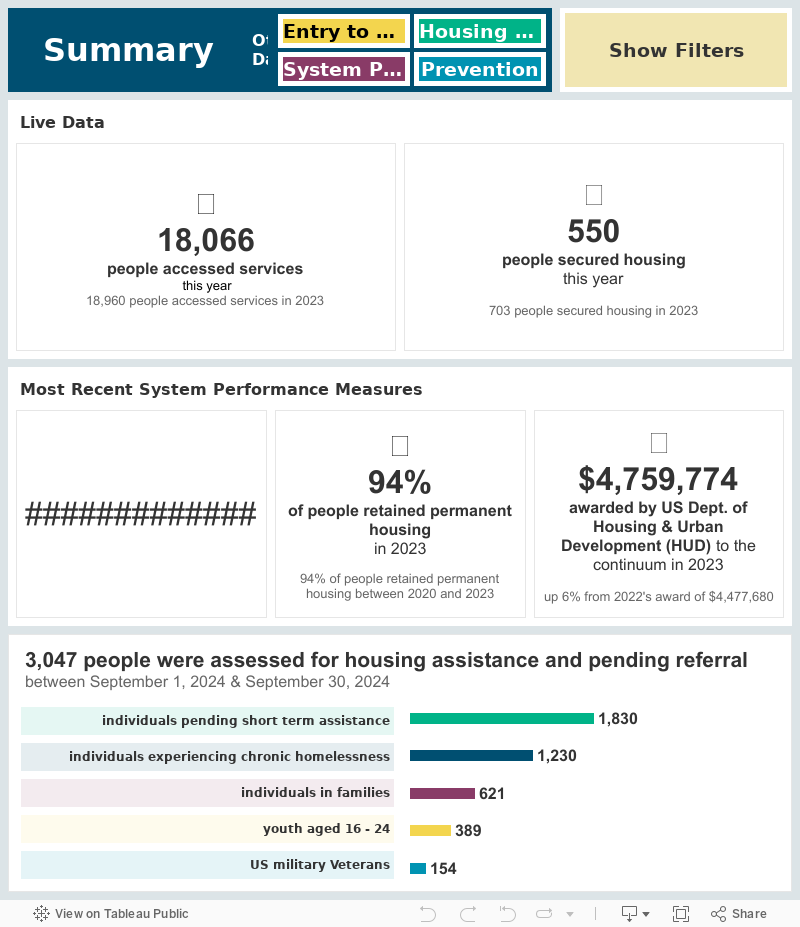
This collection of visualizations includes interactive, adaptable views into the client experience within Tulsa’s continuum of housing-related services. To view a breakdown of A Way Home for Tulsa’s system performances measures, scroll down.
You can use the demographic bar charts behind the filters button in the top right to dig deeper into the data. Use the escape key to clear the demographic filters, which will accumulate with every selection.
Each month’s data will be added to the dashboard during the third week of the following month.
Annual Point-In-Time Data
Every year, A Way Home for Tulsa provides the federal government with a summary of the survey of people experiencing homeless at the end of January.